
Corporate Weapon
noob lesson
Overview
The purpose of our system is to replace manual report generation with processes that build and distribute it programatically. Once the code is written and outputs audited for correctness, it can be used in perpetuity to generate the report quickly and more efficiently. Why does this matter? It doesn't. We should be on Tik Tok dancing and slinging merch. But if you're terrible at dancing, you can use automation to delegate tasks from your workflow to a computer, saving time (the scarcest resource) over the long-term.
Step 1: Data Aggregation & Manipulation
In our example, we are importing raw data from a CSV file. Ideally, users are querying a database to retrieve data, but the concept here is the same: import raw data into a DataFrame (DF). Once the DF is created, our function 'x1_manipulate_data.py' performs various calculations:
- Converts the UNIX datetime format to a more readable format.
- Calculates annual transactions and fees.
- Calculates transactions by epoch (i.e. every 5 days).
- Exports our 2 processed DFs (calculated above) to CSV files.
x1_manipulate_data.py
import pandas as pd
import datetime as dt
pd.set_option('display.max_columns', None)

def manipulateData():
    try:
        print("Begin data manipulation...")

        ## Import file containing raw data
        path = "data/raw/epoch_data.csv"

        ## Create DF
        df = pd.read_csv(path)

        ## Create empty lists to append converted time
        converted_start_time = []
        converted_end_time = []
        year_start = []
        year_end = []

        ## Iterate over DF to convert timestamps
        for i, r in df.iterrows():
            start = dt.datetime.fromtimestamp(int(r['start_time'])).strftime('%Y-%m-%d')
            start2 = dt.datetime.fromtimestamp(int(r['start_time'])).strftime('%Y')
            converted_start_time.append(start)
            year_start.append(start2)
            end = dt.datetime.fromtimestamp(int(r['end_time'])).strftime('%Y-%m-%d')
            end2 = dt.datetime.fromtimestamp(int(r['start_time'])).strftime('%Y')
            converted_end_time.append(end)
            year_end.append(end2)

        new_df = df.copy()

        ## Replace old timestamps with converted timestamps
        new_df['start_time'] = converted_start_time
        new_df['end_time'] = converted_end_time
        new_df['year_start'] = year_start
        new_df['year_end'] = year_end
        # print(new_df)

        ## Calculate Annual Transactions & Fees DF
        yearly_tx_fees_df = new_df[['year_end', 'tx_count', 'fees']]
        yearly_tx_fees_df = yearly_tx_fees_df.groupby('year_end').sum().reset_index()
        yearly_tx_fees_df[['tx_count', 'fees']] = yearly_tx_fees_df[['tx_count', 'fees']].astype(int)
        yearly_tx_fees_df.to_csv('data/processed/sum_yearly_tx_and_fees.csv', index=False)
        # print(yearly_tx_fees_df)

        ## Transactions Over Time DF
        transactions_over_time_df = new_df[['epoch', 'tx_count']]
        # print(transactions_over_time_df)
        transactions_over_time_df.to_csv('data/processed/transactions_over_time.csv', index=False)
        print("Data manipulation successful!")

    except:
        print("Data manipulation failed!")
Step 2: Data Visualization
After processing and saving the final outputs in separate files, the data is ready for visualization. Our example creates visualizations from 2 functions in a separate Python script: a line and bar graph illustrating the Cardano blockchain's transaction data over time. The visualizations are saved separately in the 'figures' directory as .png files.
x2_plot_filtered_data.py
Epoch Transactions - Line
import pandas as pd
import matplotlib.pyplot as plt
import matplotlib.ticker as ticker
pd.set_option('display.max_columns', None)

def plotTransactions():
    try:
        print("Beginning transactions line plot...")
        path = 'data/processed/transactions_over_time.csv'
        df = pd.read_csv(path)
        # print(df)

        fig = plt.figure(figsize=(10,6))
        ax = fig.add_subplot(111)
        ax.plot(df['epoch'], df['tx_count'])
        ax.xaxis.set_major_locator(ticker.MultipleLocator(25)) # set BIG ticks
        ax.yaxis.set_major_locator(ticker.MultipleLocator(100000)) # set BIG ticks
        ax.yaxis.set_major_formatter(ticker.StrMethodFormatter('{x:,.0f}'))
        ax.set_ylim(0, 1600000)
        ax.set_xlim(0, 455)
        plt.xlabel('Epoch')
        plt.ylabel('Transactions')
        plt.title('Transactions Over Time')
        plt.savefig('figures/line_transactions.png')
        # plt.show()
        print("Transactions line graph saved!")

    except:
        print("Transactions line graph not saved!")
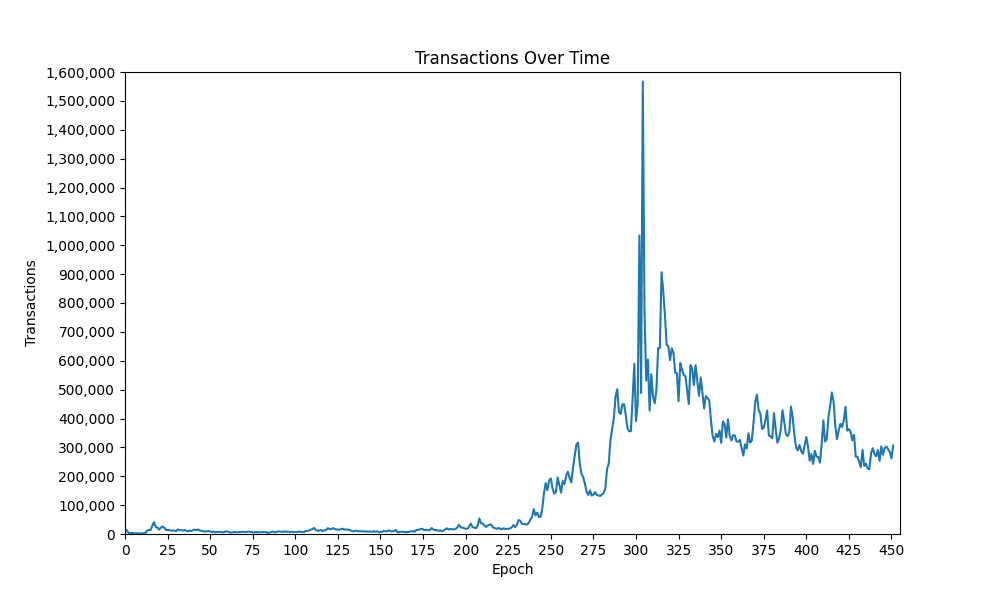
Output
Yearly Transactions - Bar
def plotYearly():
    try:
        print("Beginning transactions bar graph...")
        path = 'data/processed/sum_yearly_tx_and_fees.csv'
        df = pd.read_csv(path)
        # print(df)

        fig = plt.figure(figsize=(10,6))
        ax = fig.add_subplot(111)
        ax.bar(df['year_end'], df['tx_count'])
        # ax.xaxis.set_major_locator(ticker.MultipleLocator(25)) # set BIG ticks
        # ax.yaxis.set_major_locator(ticker.MultipleLocator(100000)) # set BIG ticks
        ax.yaxis.set_major_formatter(ticker.StrMethodFormatter('{x:,.0f}'))
        ax.set_ylim(0, 35000000)
        plt.xlabel('Epoch')
        plt.ylabel('Transactions')
        plt.title('Transactions By Year')
        plt.savefig('figures/bar_transactions.png')
        # plt.show()
        print("Transactions bar graph saved!")

    except:
        print("Transactions bar graph not saved!")
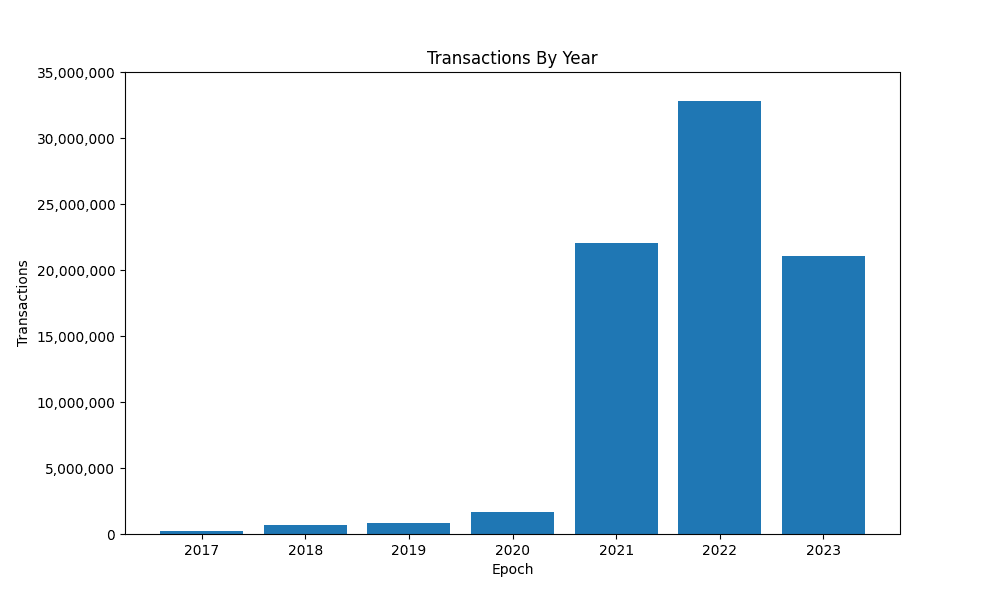
Output
Step 3: Export Visualizations to PowerPoint (PPTX)
Once the visualizations are saved as individual .png files, they can be imported into PowerPoint slides using the python-pptx libary. Our example uses the 'x3_export_to_pptx.py' script to add the .png files to our 'template.pptx' which only includes a title for each visualization's respective slide.
x3_export_to_pptx.py
from pptx import Presentation
from pptx.util import Inches  #Can simply transfer number to inches

def createPPTX():
    try:
        print('Creating PPTX from template...')
        prs = Presentation('template.pptx')
        bar_transactions = 'figures/bar_transactions.png'
        line_transactions = 'figures/line_transactions.png'

        page_id = {i+1: slide.slide_id for i, slide in enumerate(prs.slides)}

        # Get the first slide
        slide1 = prs.slides.get(page_id[1])
        pic = slide1.shapes.add_picture(bar_transactions,
                                        left=Inches(0.5),
                                        top=Inches(1.25),
                                        width=Inches(12.5),
                                        height=Inches(6))

        # Get the second slide
        slide2 = prs.slides.get(page_id[2])
        pic = slide2.shapes.add_picture(line_transactions,
                                    left=Inches(0.5),
                                    top=Inches(1.25),
                                    width=Inches(12.5),
                                    height=Inches(6))

        prs.save('monthly_transaction_report.pptx')
        print('Monthly PPTX saved!')

    except:
        print("Monthly PPTX not saved!")
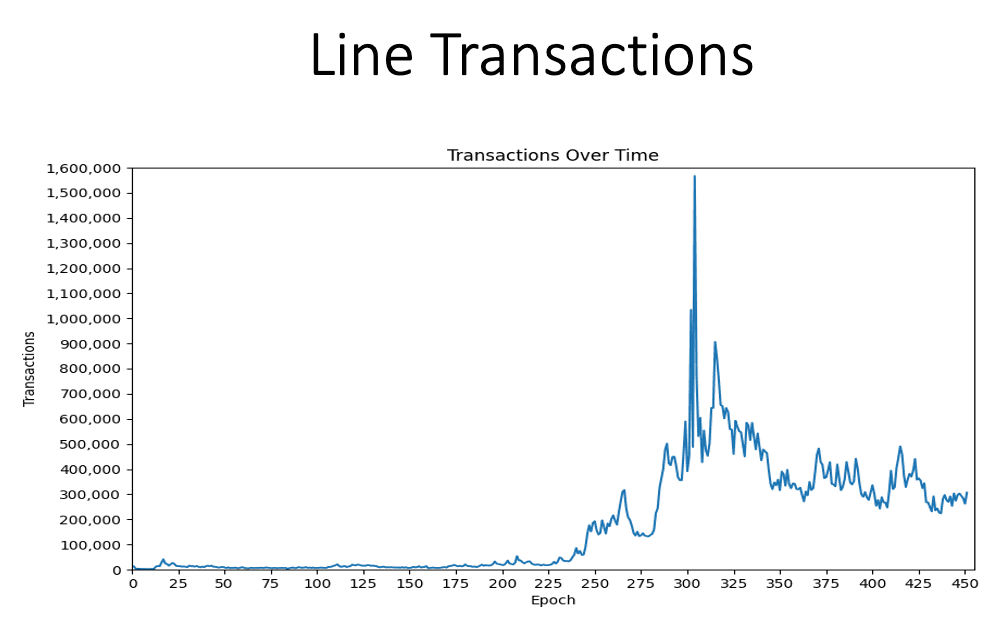
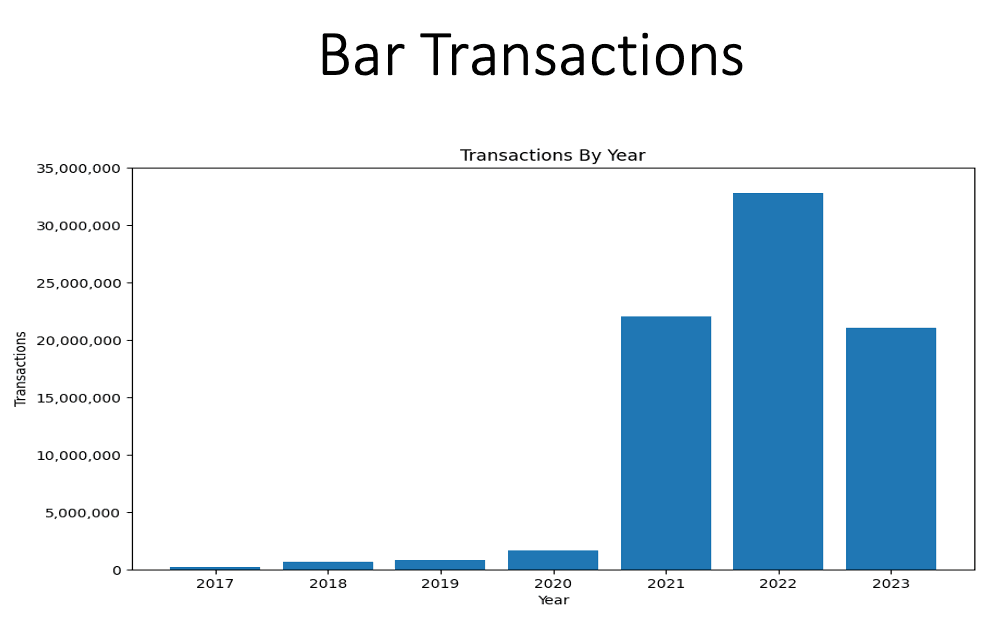
PPTX Outputs
Step 4: Email to Stakeholders
Now that are monthly PPTX report has been created, the final step is to email it to the target audience. We can email our report our programatically using the MIME and smtplib packages.
x4_email_to_stakeholders.py
import smtplib
from email.mime.text import MIMEText
from email.mime.multipart import MIMEMultipart
from email.mime.base import MIMEBase
from email import encoders
import os.path

def sendEmail():
    try:
        print("Creating email with monthly report...")
        # Login information for email sender
        sender = 'abc123@gmail.com' # replace
        password = 'Password123!' # replace

        # Email recipient(s)
        recipients = ['employee1@gmail.com', 'employee2@gmail.com',
                        'employee3@gmail.com'] # replace

        # Create email subject and body
        subject = "Monthly Transaction Report"
        html = """\
            <html>
                <head></head>
                <body style="color: black;">
                    <div> Hi! <br> </div>
                        <p style="align-items: center;">
                            Please see the attached PPTX detailing the updated transaction data for the Cardano blockchain. Contact management to discuss any comments or questions.
                        </p>
                    <div style="margin-top: 25px">
                        Yours truly, <br>
                        Bot X-145
                    </div>
                </body>
            </html>
        """

        # PDF file
        file_location = 'monthly_transaction_report.pptx'

        # Create the attachment file
        filename = os.path.basename(file_location)
        attachment = open(file_location, "rb")
        part = MIMEBase('application', 'octet-stream')
        part.set_payload(attachment.read())
        encoders.encode_base64(part)
        part.add_header('Content-Disposition', "attachment; filename= %s" % filename)

        # Connect and login to the email server

        # Outlook Example
        server = smtplib.SMTP('smtp-mail.outlook.com', 587)

        # Login to your email
        server.starttls()
        server.login(sender, password)

        # Setup MIMEMultipart for each email address (if we don't do this, the emails will concat on each email sent)
        msg = MIMEMultipart()
        msg['From'] = sender
        msg['To'] = ', '.join(recipients)
        msg['Subject'] = subject

        # Attach the message to the MIMEMultipart object
        msg.attach(MIMEText(html, 'html'))

        # Attach the attachment file
        msg.attach(part)

        # Send the email to this specific email address
        server.send_message(msg)

        # Quit the email server when everything is done
        server.quit()
        print("Monthly email report sent!")

    except:
        print("Monthly email report not sent!")
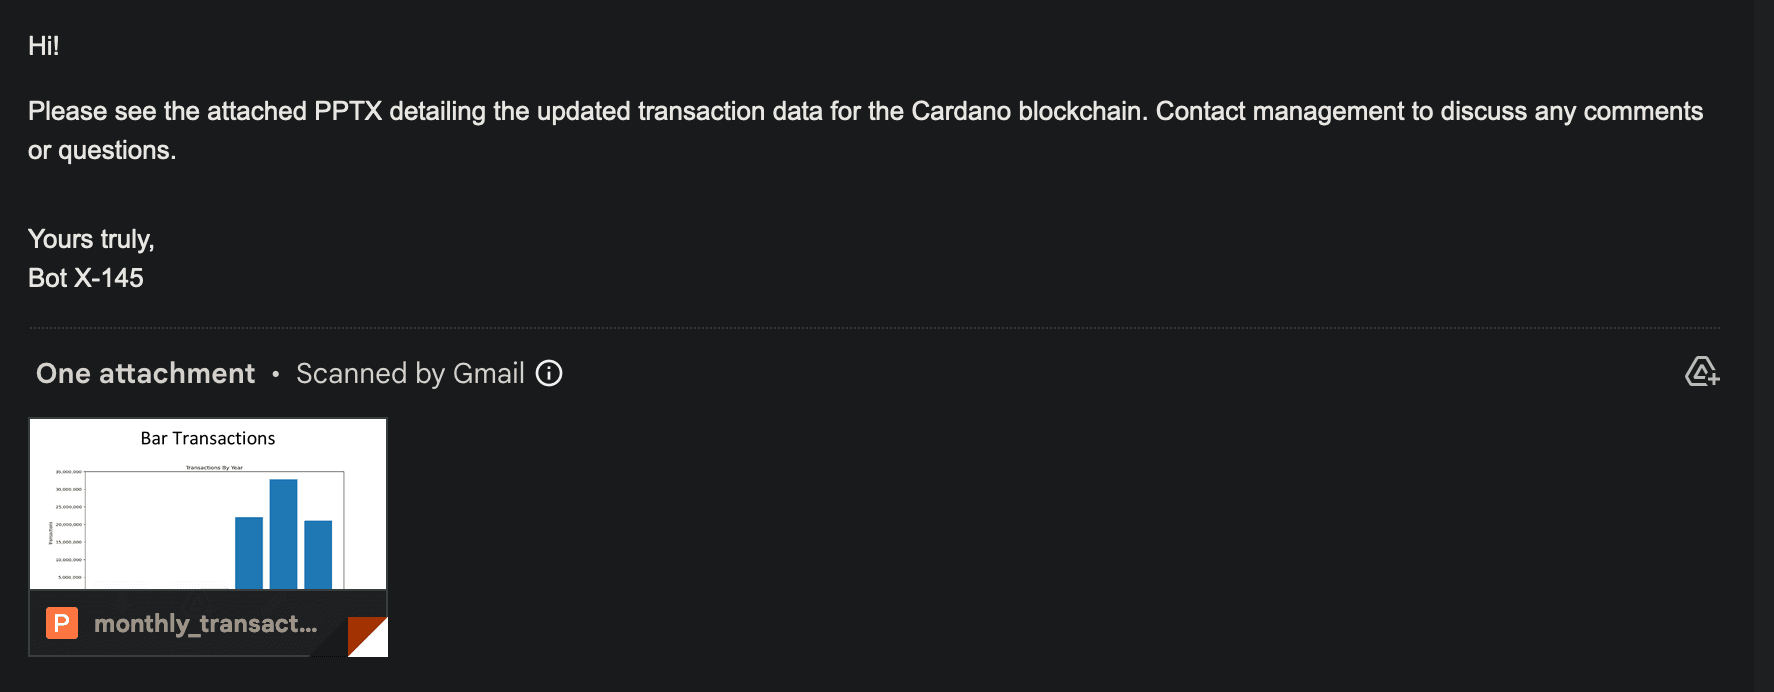
Email Received
Step 5: Creating One Script To Run The Whole Process
Our final step is to take the functions created in our 4 previous scripts and import them into our final 'x5_run_all_functions.py' script. Once all of our functions are imported, we only need to run the x5 file to generate our monthly report.
x5_run_all_functions.py
from x1_manipulate_data import manipulateData
from x2_plot_filtered_data import plotTransactions, plotYearly
from x3_export_to_pptx import createPPTX
from x4_email_to_stakeholders import sendEmail

manipulateData()
plotTransactions()
plotYearly()
createPPTX()
sendEmail()